Methodology
1. Solar Potential Areas and Onshore Wind Potential Areas
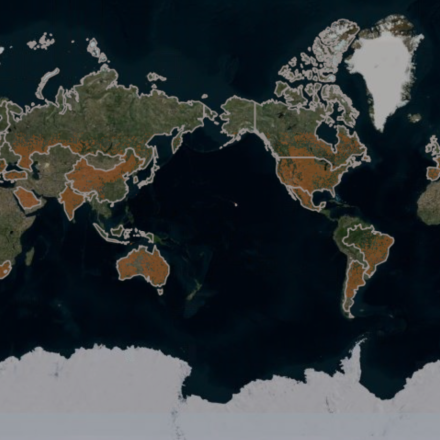
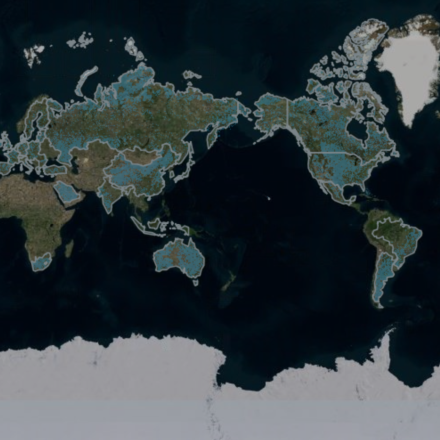
The primary purpose of GIS mapping is to identify indicative areas for future solar energy projects and onshore wind energy projects, and to project the renewable energy resources available in the Group of Twenty (G20) – Argentina, Australia, Brazil, Canada, China, France, Germany, India, Indonesia, Italy, Japan, the Republic of Korea, Mexico, Russia, Saudi Arabia, South Africa, Turkey, the United Kingdom (UK), and the United States of America (USA), and the European Union (EU). Mapping was performed with the software ESRI ArcGIS10.6.1. Both maps were developed respectively using the same methodology, but using different criteria. The areas of land available for potential solar and wind power generation were calculated and visualised by country/region using ArcGIS.
Open-source spatial data from various sources have been collected, processed and overlaid to develop (1) Solar Potential Area and (2) Onshore Wind Potential Area maps for all G20 member countries/region. The main data sources and assumptions made for this mapping are summarised in Table 1.
Table 1: GIS-mapping – data sources and assumptions
Data | Assumptions | Source |
Land cover | Land cover classes, which are suitable for solar energy and wind energy production were identified from different land-cover maps respectively. see Appendix for detailed information. | All countries (except countries below): Copernicus Global Land Cover – 2019 USA: National Land Cover Database – 2019 Europe (EU27, UK, Turkey): Copernicus Corine Land Cover – 2018 Australia: Catchment scale land use of Australia – December 2020 |
Digital Elevation Model (DEM) | For both wind and solar analyses, any land with a slope ˃30% was eliminated from all scenarios. | EU27, UK, Japan: Multi-Error-Removed Improved-Terrain DEM Canada, USA: GMTED2010 |
Protected areas | All protected areas designated under national parks, wildlife reserves, hunting reserves, conservation area and buffer zones were eliminated from all scenarios. | The World Database on Protected Areas (WDPA) |
Solar irradiance (Direct normal irradiation: DNI) | The average yearly direct normal insolation/irradiation (DNI) values range from 1 to 5 MWh/m2 per year. | Global Solar Atlas |
Wind speed at 100m | Wind speeds ≥5 m/s were considered at a height of 100 m. | Global Wind Atlas |
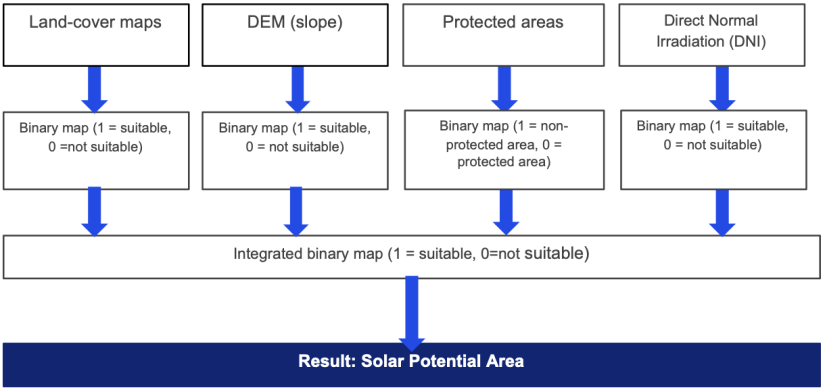
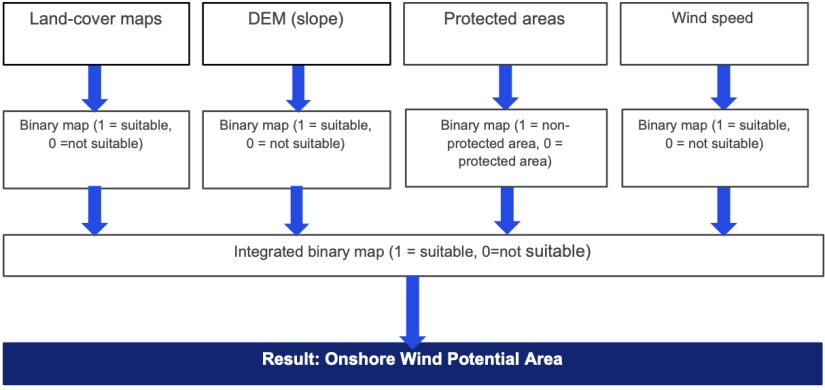
The mapping procedure is summarised for Solar Potential Area (Figure 1) and for Onshore Wind Potential Area (Figure 2). The procedures involved:
- Spatial data were obtained from various public sources, including land-cover maps (or land use maps), slope data generated from Digital Elevation Model (DEM), protected area maps, solar irradiation (Direct normal irradiation: DNI) and wind speed data (Table 1).
- The data was all converted into binary maps (0=Not potential area, 1= Potential area) against all assumptions (Table 1).
- All data was combined into one binary map by overlaying all the raster data. This map integrates all above criteria as one map having value 1 (included in potential area) or value 0 (not included in potential area) (Figure 1 & 2).
Figure 1: Solar Potential Area
Figure 2: Onshore Wind Potential Area
2. Calculation of potential areas and energy potentials
The maps were prepared in raster with 250m x 250m cell. The indicative potential areas were calculated based on the count of the cells for all G20.
The solar energy potential was calculated for all G20 based on the identified Solar Potential Area and an assumption that the installed capacity per square kilometre is 25 MW on average
The onshore wind energy potential was calculated for all G20 based on the identified Onshore Wind Potential Area and the assumption that the average installed capacity per square kilometre is 5 MW.
Limitations
The maps address limitations due to requirements for further considerations of local contexts on each location. The maps can serve as indicative location maps.
The availability of solar irradiance for the area between 60°N to 45°S only.
Area calculations of both Solar Potential Areas (km2) and Onshore Wind Potential Areas (km2) provided in the maps may have a slight range (maximum ± 10 percent) due to the distortion of areas in the maps.
Data access
Data can be accessible upon request.
A/Prof. Dr Sven Teske | University of Technology Sydney, Institute for Sustainable Futures
e-mail: SvenTeske@uts.edu.au
Dr Saori Miyake | University of Technology Sydney, Institute for Sustainable Futures
e-mail: Saori.Miyake@uts.edu.au
Appendix
Land cover classes included for solar and wind energy areas:
Data | Solar energy | Wind energy |
Copernicus Global Land Cover 2019 (world) | - Open forest, evergreen needle leaf (121)
- Open forest, deciduous needle leaf (123)
- Open forest, evergreen broad leaf (122)
- Open forest, deciduous broad leaf (124)
- Open forest, mixed (125)
- Open forest, unknown (126)
- Shrubs (20)
- Herbaceous vegetation (30)
- Bare / sparse vegetation (60)
- Cultivated and managed vegetation/agriculture (cropland) (40)
- Urban / built up (50)
| - Open forest, evergreen needle leaf (121)
- Open forest, deciduous needle leaf (123)
- Open forest, evergreen broad leaf (122)
- Open forest, deciduous broad leaf (124)
- Open forest, mixed (125)
- Open forest, unknown (126)
- Shrubs (20)
- Herbaceous vegetation (30)
- Bare / sparse vegetation (60)
- Cultivated and managed vegetation/agriculture (cropland) (40)
- (Open sea) (200)
|
Corine Land Cover 2018 (Europe) | - Discontinuous urban fabric (1.1.2)
- Industrial or commercial units and public facilities (1.2.1)
- Dump sites (1.3.2)
- Non-irrigated arable land (2.1.1)
- Permanently irrigated arable land (2.1.2)
- Rice fields (2.1.3)
- Vineyards (2.2.1)
- Fruit tree and berry plantations (2.2.2)
- Olive groves (2.2.3)
- Pastures, meadows and other permanent grasslands under agricultural use (2.3.1)
- Annual crops associated with permanent crops (2.4.1)
- Complex cultivation patterns (2.4.2)
- Land principally occupied by agriculture, with significant areas of natural vegetation (2.4.3)
- Agro-forestry areas (2.4.4)
- Natural grassland (3.2.1)
- Sclerophyllous vegetation (3.2.3)
- Transitional woodland/shrub (3.2.4)
- Bare rock (3.3.2)
- Sparsely vegetated areas (3.3.3)
| - Dump sites (1.3.2)
- Non-irrigated arable land (2.1.1)
- Permanently irrigated arable land (2.1.2)
- Rice fields (2.1.3)
- Pastures, meadows and other permanent grasslands under agricultural use (2.3.1)
- Annual crops associated with permanent crops (2.4.1)
- Complex cultivation patterns (2.4.2)
- Land principally occupied by agriculture, with significant areas of natural vegetation (2.4.3)
- Agro-forestry areas (2.4.4)
- Natural grassland (3.2.1)
- Sclerophyllous vegetation (3.2.3)
- Transitional woodland/shrub (3.2.4)
- Sparsely vegetated areas (3.3.3)
- (Sea and Ocean) (5.2.3)
|
National Land Cover Database 2019 (USA) | - Developed, Open Space (21)
- Developed, Low Intensity (22)
- Developed, Medium Intensity (23)
- Developed High Intensity (24)
- Barren Land (Rock/Sand/Clay) (31)
- Dwarf Scrub (51)
- Shrub/Scrub (52)
- Grassland/Herbaceous (71)
- Sedge/Herbaceous (72)
- Pasture/Hay (81)
- Cultivated Crops (82)
| - Developed, Open Space (21)
- Dwarf Scrub (51)
- Shrub/Scrub (52)
- Grassland/Herbaceous (71)
- Sedge/Herbaceous (72)
- Pasture/Hay (81)
- Cultivated Crops (82)
|
Catchment scale land use of Australia 2020 (Australia) | - Other minimal use (1.3.0)
- Defence land - natural areas (1.3.1)
- Residual native cover (1.3.3)
- Rehabilitation (1.3.4)
- Grazing native vegetation (2.1.0)
- All land subclasses under ‘Grazing modified pastures’ (3.2.0 – 3.2.5)
- All land subclasses under ‘Cropping’ (3.3.0-3.3.8)
- All land subclasses under ‘Perennial horticulture’ (3.4.0 – 3.4.9)
- All land subclasses under ‘Seasonal horticulture’ (3.5.0 – 3.5.3)
- All land subclasses under ‘Land in transition’ (3.6.0 – 3.6.5)
- All land subclasses under ‘Grazing irrigated modified pastures’ (4.2.0 – 4.2.4)
- All land subclasses under ‘Irrigated cropping’ (4.3.0 – 4.3.9)
- All land subclasses under ‘Irrigated perennial horticulture’ (4.4.0 – 4.4.9)
- All land subclasses under ‘Irrigated seasonal horticulture’ (4.5.0 – 4.5.4)
- All land subclasses under ‘Irrigated land in transition’ (4.6.0 – 4.6.5)
- All land subclasses under ‘Intensive horticulture’ (5.1.0– 5.1.5)
- All land subclasses under ‘Intensive animal production’ (5.2.0– 5.2.8)
- All land subclasses under ‘Manufacturing and industrial’ (5.3.0– 5.3.8)
- All land subclasses under ‘Residential and farm infrastructure’ (5.4.0– 5.4.5)
- All land subclasses under ‘Services’ (5.5.0– 5.5.5)
- Utilities (5.6.0)
- Fuel powered electricity generation (5.6.2)
- Hydro electricity generation (5.6.2)
- Solar electricity generation (5.6.4)
- Extractive Industry not in use (5.8.4)
- All land subclasses under ‘Waste treatment and disposal (5.9.0 – 5.9.5) except ‘effluent pond (5.9.1)’
| - Other minimal use (1.3.0)
- Residual native cover (1.3.3)
- Rehabilitation (1.3.4)
- Grazing native vegetation (2.1.0)
- All land subclasses under ‘Grazing modified pastures’ (3.2.0 – 3.2.5)
- All land subclasses under ‘Cropping’ (3.3.0-3.3.8)
- All land subclasses under ‘Seasonal horticulture’ (3.5.0 – 3.5.3)
- All land subclasses under ‘Land in transition’ (3.6.0 – 3.6.5)
- All land subclasses under ‘Grazing irrigated modified pastures’ (4.2.0 – 4.2.4)
- All land subclasses under ‘Irrigated cropping’ (4.3.0 – 4.3.9)
- All land subclasses under ‘Irrigated land in transition’ (4.6.0 – 4.6.5)
- All land subclasses under ‘Intensive horticulture’ (5.1.0– 5.1.5)
- All land subclasses under ‘Intensive animal production’ (5.2.0– 5.2.8)
- Abandoned manufacturing and industrial (5.3.8)
- Rural residential with agriculture (5.4.2)
- Remote communities (5.4.4)
- Farm buildings/infrastructure (5.4.5)
- Wind electricity generation (5.6.3)
- Extractive Industry not in use (5.8.4)
- Landfill (5.9.2)
- Solid garbage (5.9.3)
|
Land-cover classes NOT included for solar and wind energy areas:
Data | Solar energy | Wind energy |
Copernicus Global Land Cover 2019 (world) | - Closed forest, evergreen needle leaf (111)
- Closed forest, deciduous needle leaf (113)
- Closed forest, evergreen, broad leaf (112)
- Closed forest, deciduous broad leaf (114)
- Closed forest, mixed (115)
- Closed forest, unknown (116)
- Herbaceous wetland (90)
- Moss and lichen (100)
- Snow and Ice (70)
- Permanent water bodies (80)
- Open sea (200)
| - Closed forest, evergreen needle leaf (111)
- Closed forest, deciduous needle leaf (113)
- Closed forest, evergreen, broad leaf (112)
- Closed forest, deciduous broad leaf (114)
- Closed forest, mixed (115)
- Closed forest, unknown (116)
- Herbaceous wetland (90)
- Moss and lichen (100)
- Urban / built up (50)
- Snow and Ice (70)
- Permanent water bodies (80)
|
Corine Land Cover 2018 (Europe) | - Continuous urban fabric (1.1.1)
- Road and rail networks and associated land (1.2.2)
- Port areas (1.2.3)
- Airports (1.2.4)
- Mineral extraction sites (1.3.1)
- Construction sites (1.3.3)
- Green urban areas (1.4.1)
- Sport and leisure facilities (1.4.2)
- Broad-leaved forest (3.1.1)
- Coniferous forest (3.1.2)
- Mixed forest (3.1.3)
- Moors and heathland (3.2.2)
- Beaches, dunes, and sand plains (3.3.1)
- Burnt areas (3.3.4)
- Glaciers and perpetual snow (3.3.5)
- Inland marshes (4.1.1)
- Peatbogs (4.1.2)
- Coastal salt marshes (4.2.1)
- Salines (4.2.2)
- Intertidal flats (4.2.3)
- Water courses (5.1.1)
- Water bodies (5.1.2)
- Coastal lagoons (5.2.1)
- Estuaries (5.2.2)
- Sea and ocean (5.2.3)
| - Continuous urban fabric (1.1.1)
- Discontinuous urban fabric (1.1.2)
- Industrial or commercial units and public facilities (1.2.1)
- Road and rail networks and associated land (1.2.2)
- Port areas (1.2.3)
- Airports (1.2.4)
- Mineral extraction sites (1.3.1)
- Construction sites (1.3.3)
- Green urban areas (1.4.1)
- Sport and leisure facilities (1.4.2)
- Vineyards (2.2.1)
- Fruit tree and berry plantations (2.2.2)
- Olive groves (2.2.3)
- Broad-leaved forest (3.1.1)
- Coniferous forest (3.1.2)
- Mixed forest (3.1.3)
- Moors and heathland (3.2.2)
- Beaches, dunes, and sand plains (3.3.1)
- Bare rock (3.3.2)
- Burnt areas (3.3.4)
- Glaciers and perpetual snow (3.3.5)
- Inland marshes (4.1.1)
- Peatbogs (4.1.2)
- Coastal salt marshes (4.2.1)
- Salines (4.2.2)
- Intertidal flats (4.2.3)
- Water courses (5.1.1)
- Water bodies (5.1.2)
- Coastal lagoons (5.2.1)
- Estuaries (5.2.2)
|
National Land Cover Database 2019 (USA) | - Open Water (11)
- Perennial Ice/Snow (12)
- Deciduous Forest (41)
- Evergreen Forest (42)
- Mixed Forest (43)
- Lichens (73)
- Moss (74)
- Woody Wetlands (90)
- Emergent Herbaceous Wetlands (95)
| - Open Water (11)
- Perennial Ice/Snow (12)
- Developed, Low Intensity (22)
- Developed, Medium Intensity (23)
- Developed High Intensity (24)
- Barren Land (Rock/Sand/Clay) (31)
- Deciduous Forest (41)
- Evergreen Forest (42)
- Mixed Forest (43)
- Lichens (73)
- Moss (74)
- Woody Wetlands (90)
- Emergent Herbaceous Wetlands (95)
|
Catchment scale land use of Australia 2020 (Australia) | - All land subclasses under ‘Nature conservation’ (1.1.0 – 1.1.7)
- All land subclasses under ‘Managed resource protection’ (1.2.0 – 1.2.5)
- Stock route (1.3.2)
- All land subclasses under ‘Production native forests’ (2.2.0 - 2.2.2)
- All land subclasses under ‘Plantation forests’ (3.1.0 – 3.1.4)
- All land subclasses under ‘Irrigated plantation forests’ (4.1.0 – 4.1.4)
- Wind electricity generation (5.6.3)
- Electricity substations and transmission (5.6.5)
- Gas treatment, storage and transmission (5.6.6)
- Water extraction and transmission (5.6.7)
- All land subclasses under ‘Transport and communication’ (5.7.0 – 5.7.5)
- All land subclasses under ‘Mining’ (5.8.0 – 5.8.3)
- Effluent pond (5.9.1)
- All land classes and subclasses under ‘Lake’ (6.1.0 -6.1.4), ‘Reservoir/dam’ (6.2.0 – 6.2.3), ‘River’ (6.3.0 -6.3.3), ‘Channel/aqueduct‘(6.4.0 – 6.4.3), ‘Marsh/wetland’ (6.5.0 – 6.5.4) and ‘Estuary/coastal waters (6.6.0 – 6.6.3)’.
| - All land subclasses under ‘Nature conservation’ (1.1.0 – 1.1.7)
- All land subclasses under ‘Managed resource protection’ (1.2.0 – 1.2.5)
- Defence land - natural areas (1.3.1)
- Stock route (1.3.2)
- All land subclasses under ‘Production native forests’ (2.2.0 - 2.2.2)
- All land subclasses under ‘Plantation forests’ (3.1.0 – 3.1.4)
- All land subclasses under ‘Perennial horticulture’ (3.4.0 – 3.4.9)
- All land subclasses under ‘Irrigated plantation forests’ (4.1.0 – 4.1.4)
- All land subclasses under ‘Irrigated perennial horticulture’ (4.4.0 – 4.4.9)
- All land subclasses under ‘Irrigated seasonal horticulture’ (4.5.0 – 4.5.4)
- All land subclasses under ‘Manufacturing and industrial’ (5.3.0– 5.3.7)
- Urban residential (5.4.1)
- Rural residential without agriculture (5.4.3)
- All land subclasses under ‘Services’ (5.5.0– 5.5.5)
- All land subclasses under ‘Utilities’ (5.6.0 -5.6.7) except ‘Wind electricity generation’ (5.6.3)
- All land subclasses under ‘Transport and communication’ (5.7.0 – 5.7.5)
- All land subclasses under ‘Mining’ (5.8.0 – 5.8.3)
- Waste treatment and disposal (5.9.0)
- Effluent pond (5.9.1)
- Incinerators (5.9.4)
- Sewage/sewerage (5.9.5)
- All land classes and subclasses under ‘Lake’ (6.1.0 -6.1.4), ‘Reservoir/dam’ (6.2.0 – 6.2.3), ‘River’ (6.3.0 -6.3.3), ‘Channel/aqueduct‘(6.4.0 – 6.4.3), ‘Marsh/wetland’ (6.5.0 – 6.5.4) and ‘Estuary/coastal waters (6.6.0 – 6.6.3)’.
|


