Achieving the goals of the Paris Climate Agreement (2015) will require the total decarbonisation of the global energy system by 2050, with an emissions peak between 2020 and 2025 and a drastic reduction in non-energy-related greenhouse gases (GHGs), including land-use-related emissions. Based on the Agreement, countries have agreed to regularly report their GHG emissions and submit their ‘Nationally Determined Contributions’ (NDC), describing their planned measures to reduce GHG emissions.
The Global Budget to limit global temperature rise to +1.5°C
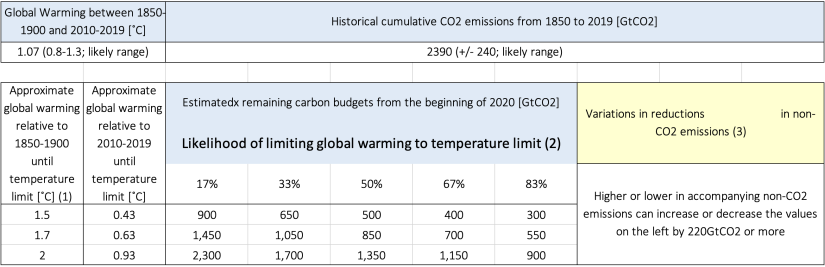
In August 2021, the IPCC, the United Nations body that assesses the science related to climate change, identified the global carbon budget required to achieve 1.5˚C between 2020 and 2050 with 67% likelihood as 400 GtCO2, or with 50% likelihood as 500 GtCO2. The table below is taken from the IPCC report and shows the carbon budgets and the likelihood to limit global warming to +1.5˚C, +1.7˚C and +2.0˚C.
The remaining carbon budget for G20 countries
The energy-related CO2 emissions of all G20 countries with the global scenario under a defined carbon budget limit have been calculated. The details of all countries’ scenario are document on the Energy Pathway (link) and the Sectoral Pathway (link) pages. The figure below shows the historic cumulative energy-related CO2 emissions in 1750–2019, and the calculated CO2 emissions under the OECM 1.5°C pathways in 2020–2050. The historic and projected energy-related CO2 emissions in 2020–2050 for each G20 country are divided by the current population to determine the country-specific emission index. The Per Capita Carbon Index (PCCI) is introduced as a benchmark with which to compare cumulative historic and projected emissions. However, the PCCI is a simplified calculation because historic and future population developments are not included. Therefore, the index is only an indication.
Carbon budgets: Historic (1750–2019) and 1.5°C pathway emissions (2020-2050) will lead to the total global emission of 2,091 GtCO2, 75% (1,570 GtCO2) of which will be emitted by the G20 countries. In terms of overall emissions, the USA is by far the greatest emitter, with 471 GtCO2—87% are historic emissions and the future emissions allowance under the OECM pathway is 58.9 GtCO2. The second greatest emitter is the 27 countries of the European Union (EU27), with 286 GtCO2 of historic emissions, 30% less than the USA.
Under the OECM 1.5°C pathway, the EU27 will decarbonise with a total remaining carbon budget of 32.9 GtCO2, 44% less than the USA, even though the EU27 population is 448 million, 26% larger than the USA. The European economy is significantly more energy efficient than the USA economy, and the renewable energy share (final energy) in 2020 was 28%, more than twice that of the USA (11%). Therefore, the faster decarbonisation of Europe’s energy system is assumed. China is the third greatest emitter, with 227 GtCO2 of historic emissions and a projected remaining carbon budget of 151 GtCO2.
The USA, EU27, and China represent 28% of the global population (in 2020) and are responsible for 56% of historic emissions (926 GtCO2). The 1.5°C OECM decarbonisation pathways for these three regions lead to a remaining carbon budget of 243 GtCO2, 57% of the total global carbon budget of 426 GtCO2. China is assumed to require the largest carbon budget to reach decarbonisation. Under the national OECM 1.5 °C decarbonisation pathway, China – with a population of 1.4 billion people, compared with 0.8 billion for the EU27 and USA combined – will cumulatively emit 151 GtCO2 in 2020–2050, more than 1.5 times the remaining carbon budget of the EU27 and USA combined.
In terms of total combined historic and projected emissions, the fourth largest emitter is Russia, with 138.2 GtCO2, followed by Germany (100.3 GtCO2). All other G20 countries – including populous India – have significantly lower cumulative emissions, although some have significantly higher per-capita emissions.
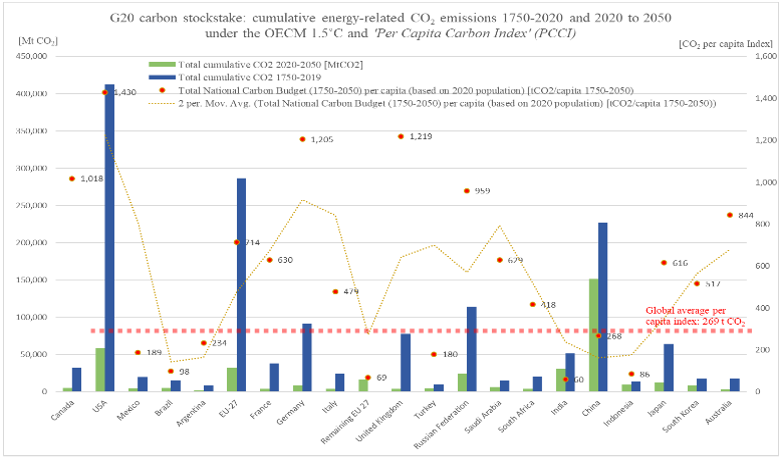
G20 carbon stocktake: cumulative energy-related CO2 emissions 1750–2020 and 2020–2050 under the OECM 1.5°C pathways and Per Capita Carbon Index (PCCI)
More details about the remaining carbon budget, the methodology and conclusion are documented in a scientific article.
One Earth Climate Model
-
 Methodologies
Read about the different methodologies used to determine energy demand, supply, how to define Scope 1, 2 and 3 emissions and renewable energy potential assessments.
-
 Dashboard
See the OECM 1.5°C pathways for countries and regions, and their industry sectors. Explore energy demand and supply developments until full decarbonisation in 2050.
-
 Energy pathways
The OECM on the development of 1.5°C net zero pathways for industry sectors classified under the Global Industry Classification Standard (GICS).