

Very hot days in Western Sydney are typically 5 degrees hotter than parts of the city close to the coast and are becoming more common, but only in the west. Four climate drivers explain the difference.

Picture: Shutterstock
Global warming has led to higher summer temperatures across Sydney over the past 30 years. However, our data analysis shows very hot summer days are becoming much more common in Western Sydney than in coastal Sydney. These hotter summers are also getting longer.
Although January and February are usually the warmest months, Greater Sydney summers now extend from December to March. For example, the city’s record-setting March has been the hottest month this summer. Summers are expanding and winters shrinking across subtropical and temperate Australia.
Our newly published analysis of temperature data from 1962-2021 shows one in ten days in summer reached temperatures of 35.4℃ or more in Western Sydney. That’s a full 5℃ hotter than near the coast, where one in ten days exceeded 30.4℃. One in 20 days reached 37.8℃ or more in the west – the equivalent figure near the coast was 33.6℃.
Furthermore, very hot days have become more common over the past 30 years in Western Sydney, but not near the coast. The difference in maximum temperatures between the regions can be as much as 10℃.
So what explains the startling difference between two parts of the same city? In our research, we show the influence of four climate drivers: El Niño-La Niña, Southern Annular Mode, global temperatures and local Tasman Sea temperatures.
Extreme heat is getting worse in the west
In our study, we calculated the threshold values for the top 10% and top 5% of summer maximum temperatures (the 90th and 95th percentiles) recorded for coastal Sydney (at Observatory Hill) and Western Sydney (at Richmond, about 50km to the north-west) over the 60 years from 1962-2021.
Comparing the first 30-year period, 1962-1991, to the second 30-year period, 1992-2021, revealed a stark difference in maximum temperature trends in Sydney’s west and nearer the coast.
In Richmond, the number of days with temperatures above 35.4℃ and 37.8℃ increased by 120 days and 64 days, respectively. In contrast, Observatory Hill recorded decreases of 4 and 52 days in days above the 90th and 95th percentiles (over 30.4℃ and 33.6℃).
What explains these differences?
Poorly planned development in the west and its distance from coastal sea breezes explains part of the disparity between inland and coastal Sydney. But we also found the increase in extreme heat in Western Sydney is due to Australian climate drivers being amplified by increased global and Tasman Sea temperatures.
Using machine-learning techniques, we were able to attribute temperature differences to the influences of these climate drivers and their interactions with each other. The results show common, highly influential climate drivers for both regions:
-
the Niño3.4, (an indicator of sea-surface temperatures in the tropical central Pacific Ocean, which drive El Niño and La Niña events)
-
the Indian Ocean Dipole (the difference in ocean temperatures between the eastern and western sides of the Indian Ocean)
-
the combination of the Southern Annular Mode (the movement of winds and weather systems to Australia’s south) with the Southern Oscillation (large-scale changes in sea-level air pressure between Tahiti and Darwin)
-
the combination of global temperature with the Southern Annular Mode.
Tasman Sea and global sea surface temperatures have had far more influence on coastal Sydney than on inland Western Sydney.
An increase in extreme heat days is having wide-ranging impacts on Western Sydney.
Despite the importance of rising temperatures in Sydney and particularly in Western Sydney, there has been little focus on their links with large-scale climate drivers. Our findings underline the worsening situation in Western Sydney compared with coastal Sydney.
Studies that employ machine-learning techniques or comparative analyses are typically done in regions of smaller populations. Western Sydney is home to more than 2.5 million people.
Its economic development and fast-growing population have led to higher concentrations of buildings and man-made surfaces, which absorb and retain more heat. Known as the urban heat island effect, it compounds the impacts of climate change. Development on this scale also presents complex challenges for policy planning and resource management.
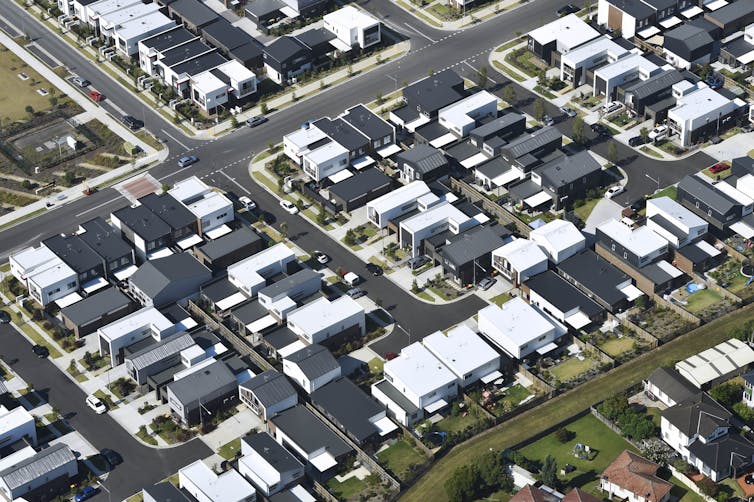
The growth of Western Sydney is driving an increase in built-up areas, like this housing estate, that absorb and retain more heat. Image: Western Sydney Regional Organisation of Councils (WSROC)
What does this mean for the people of Western Sydney?
Identifying the climate drivers that most influence maximum temperatures is crucial for Sydney’s planning. It matters for infrastructure development, health and socioeconomic wellbeing in Western Sydney in particular.
Two-thirds of Sydney’s population growth by 2036 is projected to be in Western Sydney. By then an estimated 3.5 million residents will be exposed to more extreme summer heat.
The escalating climate crisis is widening Sydney’s health and socioeconomic divide. Western Sydney has higher unemployment and a larger proportion of lower-income families than the rest of the city.
It’s imperative to understand how Western Sydney differs from near-coastal Sydney, and to plan accordingly. Some local councils in the west, such as Blacktown, are already trialling heat refuges to reduce the growing risks for residents.
Longer and more intense summers are driving longer heatwaves and droughts. It’s leading to more bushfires of greater intensity, such as the 2019-20 bushfires.
The economic burden of dealing with these disastrous events is increasing. According to the Climate Council, the costs associated with extreme weather events in Australia have more than doubled since the 1970s. Australians are now five times more likely to be displaced by such events than people living in Europe.
The urban heat island effect already permeates Western Sydney. Recent extreme temperatures have been close to the limits of human endurance. The human body’s ability to cool itself declines above 35℃, especially in humid conditions.
The impacts of more frequent extreme heat, compounded by heat island effects, are greatest for vulnerable populations such as children in classrooms without air conditioning or low-income family households. Their situation is in stark contrast to the experience of residents of cooler coastal areas. ![]()
Milton Speer, Visiting Fellow, School of Mathematical and Physical Sciences, University of Technology Sydney; Anjali Gupta, Lecturer, School of Mathematical and Physical Sciences, and Researcher, Centre for Forensic Science, University of Technology Sydney; Joanna Wang, Senior Lecturer, School of Mathematics and Physical Sciences, University of Technology Sydney; Joshua Hartigan, PhD Candidate, School of Mathematical and Physical Sciences, University of Technology Sydney, and Lance M Leslie, Professor, School of Mathematical And Physical Sciences, University of Technology Sydney
This article is republished from The Conversation under a Creative Commons license. Read the original article.