

Where you live can make a big difference to how climate-friendly your car is.

Photo: Adobe Stock Images
If you’re thinking about buying an electric vehicle, whether due to soaring fuel prices or to lower your greenhouse gas emissions, where you live can make a huge difference to how climate-friendly your car is.
New research reveals having an electric vehicle would mean less emissions than a fossil-fuelled car – but the extent to which electric vehicles can lower emissions varies in each state. Much depends on how much electricity is generated from renewable sources, such as solar, wind and hydro.
Australia-wide, the study found electric vehicles emit, on average, 29-41% less emissions than a typical fossil-fuelled car for every kilometre driven. But when you break it down into states, Tasmania is expected to see the largest drop, with 70-77% less emissions per kilometre.
This information is important for meeting climate targets, because Australia’s on-road fleet is different from the more commonly assessed fleets in the United States, Europe or Asia in terms of vehicle size, fuel type, emission standards and fuel quality.
Australia’s electric vehicle uptake
Australia won’t meet its climate target of net-zero emissions by 2050 without an overhaul of transport, as the sector accounts for around 17% of national emissions. Passenger cars alone account for around half of all our transport emissions.
Rising petrol prices might just be the incentive we need to swing public sentiment towards electric vehicles in Australia, which have a lower climate footprint.
In just two years, electric vehicle sales have tripled from 6,900 in 2020 to 20,665 in 2021. And yet, they still account for only 2% of market share in new cars.
This is a far cry from the rest of the world, where 6.6 million electric vehicles were sold globally last year. Over half were in China alone.
Thanks to a range of financial incentives, Canberrans led Austalia in the number of electric vehicles bought per capita. Motorists bought 825 new electric vehicles last year, accounting for over 5% of all vehicle sales in the territory.
Queensland, too, may see a surge in uptake, as last month the Palaszczuk Government announced a A$55 million electric vehicle package, which includes a $3,000 incentive to buy a car and $10 million for new charging infrastructure.
Comparing car emissions per kilometre
To compare the potential for emissions reduction in each state, Transport Energy/Emission Research (TER) conducted a so-called “life cycle assessment”. This considers all aspects of a vehicle’s life – from production, to operational use (driving it), to when it gets scrapped.
Life cycle assessments are a holistic way of looking at emissions but, confusingly, some studies have reached different conclusions. So TER combined a life cycle assessment with a probabilistic analysis, presenting our findings as a range of possible, but realistic, outcomes.
The average carbon emissions for a fossil-fuelled Australian car are an estimated 349-390 grams per kilometre. This is made up of approximately:
- 72% for operational use
- 13% for vehicle manufacture
- 14% for fossil fuel production and distribution.
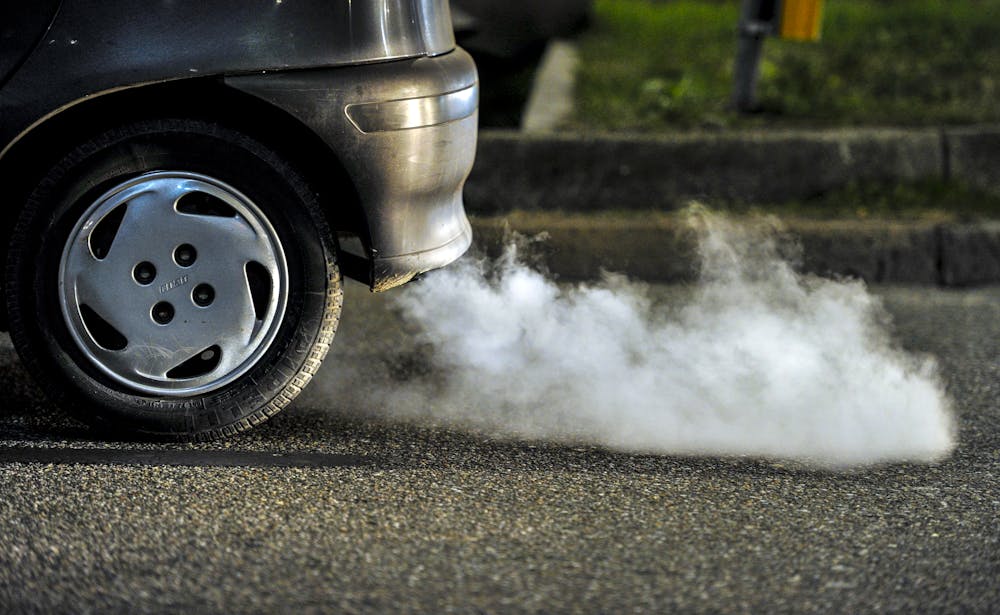
A typical Australian fossil-fuelled car emits up to 390 grams of carbon dioxide per kilometre. Shutterstock
An average battery electric car, on the other hand, is estimated to have life cycle emissions around 221-255 grams per kilometre. This is made up of approximately:
- 69% for operational use
- 23% for vehicle manufacture
- 7% for electricity production and distribution.
Infrastructure and vehicle disposal (scrappage) is estimated to have less than 1% contribution for both vehicle types.
These estimates are higher than what has been reported in European studies, reflecting Australia’s unique conditions, including high carbon intensity from coal-based electricity generation, and different fleet characteristics such as having heavier and larger cars than Europe.
Comparing each jurisdiction
The good news is, in all Australian jurisdictions, emissions released from the beginning to the end of the electric vehicle’s life are expected to be significantly less than for fossil-fuelled cars. Each, however, varies in the extent emissions will be reduced.
The largest emissions reductions will occur in Tasmania, as its electricity largely comes from renewable sources: more than 80% comes from hydroelectricity and about 10% comes from wind.
South Australia comes in second, with electric vehicles bringing 55-66% less emissions per kilometre, compared to fossil-fuelled cars. This is because a significant portion of SA’s electricity comes from wind (about 40%) and solar (more than 10%).
At the other end of the spectrum, most electricity generation in Victoria and New South Wales currently comes from coal-fired power stations.
And still, electric vehicle uptake is expected to see substantial reductions: around 9-31% in Victoria, and 17-39% in NSW. These values will improve as the electricity generation system is further decarbonised.
Squandering our potential
Australia has a huge potential for a renewables industry, thanks to our wide open spaces, windy coasts and sunny skies.
So TER also looked at a future scenario, where the national electricity mix is generated with about 10% fossil fuels and 90% renewable energy (solar, wind, hydro, biomass). In this scenario, electric vehicles nationwide are expected to provide between 74% and 80% emissions reductions.
Sadly, Australia is still far removed from this situation. Most cars sold in 2020 were large fossil-fuelled SUVs with high greenhouse gas emissions because of their size and weight.
Fossil fuel guzzling SUVs were the most popular car sold in Australia in 2020. Shutterstock
What’s more, fleet turnover is a slow process. The Australian Motor Vehicle Census reports that the average age of Australian cars is about ten years, with an average attrition rate of only about 4% each year.
This means even if all passenger vehicles sold today were electric, it would take more than ten years for the Australian road fleet to be fully electric.
Efforts to boost the share of electric vehicles in the Australian fleet needs to be stepped up urgently, alongside a rapid decarbonisation of the electricity grid.
These should, finally, align with international emission standards to reduce delays and increase choice and availability of electric vehicles in Australia.
This will ensure we’ll have at least made a significant start with emission reductions in the road transport sector by 2030.
If Australia was serious about reducing emissions – fast – rolling out electric vehicles could perhaps focus on states with the lowest carbon intensity. But given the slow fleet turnover and the current state of play, it’s essential electrification starts everywhere, now.![]()
Robin Smit, Adjunct Associate Professor, University of Technology Sydney and Hussein Dia, Professor of Future Urban Mobility, Swinburne University of Technology
This article is republished from The Conversation under a Creative Commons license. Read the original article.